
Air by the M4 and at the Three Tuns has met the legal limit for years, so Slough is revoking both pollution zones. Two others, in the town centre and Brands Hill, stay.
Slough is scrapping two of its five air pollution zones. The air along the M4 and at the Three Tuns junction has met the legal limit for nitrogen dioxide for several years running.
The council calls them Air Quality Management Areas. It has to declare one wherever pollution breaks, or is likely to break, the national objective. It can lift one only when the monitoring shows the problem has gone.
The two decisions were signed on 10 June 2026 by Pat Hayes, the executive director for regeneration, housing and environment. The council published them on 24 September, more than three months later.
Which zones go, and which stay
The limit in question is an annual average of 40 micrograms of nitrogen dioxide per cubic metre. Slough declared all five of its zones because of that pollutant, and road traffic is the main source.
Going:
- AQMA 1, the M4. Land beside the motorway between junctions 5 and 7, and southbound from junction 5 to Brands Hill, up to about 100 metres from the carriageway. Declared June 2005.
- AQMA 3 and its extension, Tuns Lane and Bath Road. The A355 from M4 junction 6 north past the Bath Road to about 200 metres up Farnham Road, plus 360 metres of the Bath Road to the east. Declared January 2011 and extended in May 2018.
Staying:
- AQMA 2, the A4 London Road at Brands Hill, east of M4 junction 5, running to 300 metres past Sutton Lane on the Colnbrook bypass.
- AQMA 4, the A4 Bath Road from Ledgers Road and Stoke Poges Lane, along Wellington Street to the Sussex Place junction.
How far the Three Tuns has come
The Tuns Lane area has been monitored for more than 25 years. The council’s decision report sets out the numbers.
- Tuns Lane peaked at 55 in 2004.
- The highest reading when the zone was declared in 2011 was 51.
- The monitor outside the Windmill Care Centre on Bath Road recorded 44.8 in 2017 and 42.1 in 2018, both over the limit.
- By 2025 the highest reading anywhere in the zone was 25.5, at a Tuns Lane site.
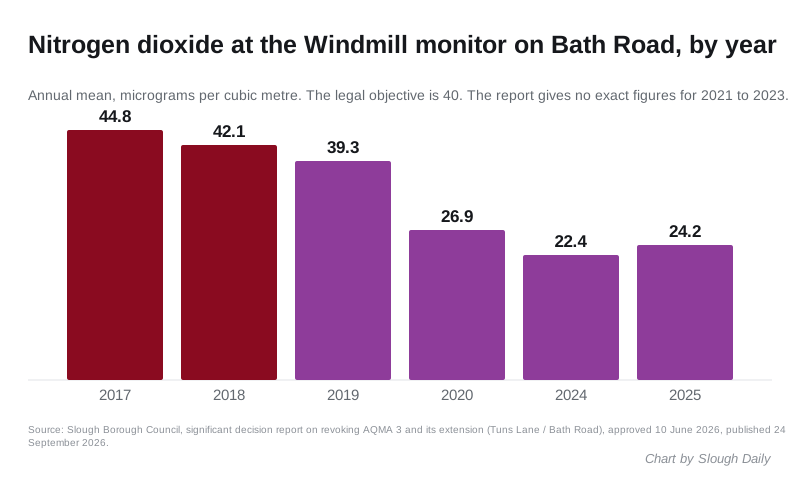
Readings from 2020 and 2021 do not count, because lockdown emptied the roads. Defra told councils to leave them out. Counting from 2022, the zone has been compliant every year, with no site within 10% of the limit.
Defra’s appraisal of the council’s 2025 annual report said both parts of the zone should be revoked, as they had “concentrations well below 10% of the AQO”.
The M4 zone
The M4 zone was declared on 23 June 2005. Modelling at the time found that motorways produced 40% of Slough’s total emissions, and that lorries were the largest contributor. The worst predicted spot was in Winvale, at 59.4.
The M4 report says every monitoring site in the zone was under the limit by 2018. The zone now has 37 diffusion tube sites, and in 2025 the highest reading among them was 21.3.
National Highways agreed to extra monitoring from October 2019 while it turned the M4 into a smart motorway. The council concludes that the scheme “has not caused a worsening of air quality”.
Defra had already written that “AQMA 1 must now be revoked” when it appraised the council’s 2024 to 2028 action plan.
The catch
The council’s own report lists two reasons to keep the zones, and both are worth knowing.
- A zone keeps air quality a priority for the council and its partners.
- Developers face a lower bar outside a zone. Under the industry planning guidance, a scheme outside an air quality zone needs more extra traffic before it triggers a full air quality assessment. So fewer developments near the Three Tuns or the M4 will need one, and there is less chance to secure mitigation or developer contributions.
The council’s answer is its Low Emission Strategy, which is being refreshed in 2026. The report suggests the refresh could require developers to keep assessing air quality in former zones for a set period. Monitoring at the sites continues, and the results will still be reported to Defra every year.
There is one early warning in the figures. Four new tubes were put in along Farnham Road to track the Destination Farnham Road works. Their readings rose by an average of 1.0 in 2025, and one rose by 3.5. All are far below the limit, and the council expects any rise from construction to be short term.
What it means for you
- Nothing changes on the street. An air quality management area is a legal designation that obliges the council to act. It is not a charge on drivers and it restricts no one.
- The air is measurably cleaner than when these zones were declared. At the Three Tuns the worst reading has roughly halved since 2011.
- Two zones remain, in the town centre on Wellington Street and at Brands Hill. The council has said it wants to revoke all of its zones by 2030.
- You can check today’s pollution levels from the council’s air quality page, which links to the monitoring data and to AirTEXT, a free alert service for people with asthma, heart or lung conditions.
If you are following building work in the area, see our Slough planning news. The Farnham Road and A4 works are on our roadworks page.
Have your say