
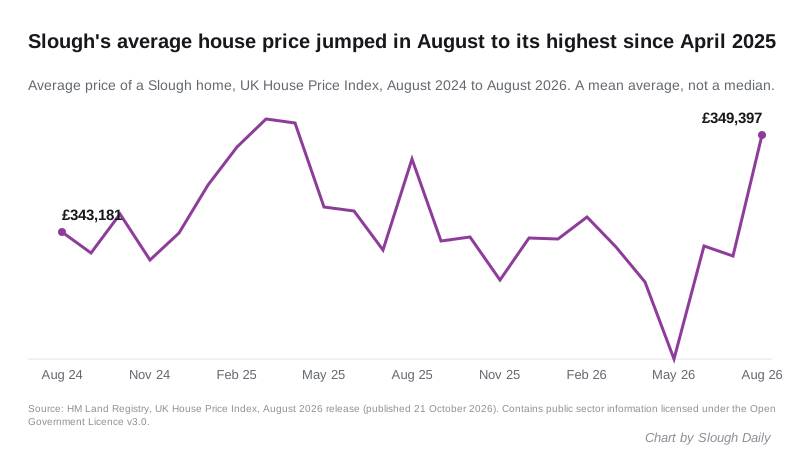
The average Slough home rose 2.3% in August to £349,397, the 8th biggest monthly rise in England and the highest since April 2025. July was revised up £5,924.
The average Slough home was worth £349,397 in August 2026, up 2.3% in a month. That is the highest the official index has put the borough since April 2025. Over the year, prices are up £1,532, or 0.4%.
The figures come from the UK House Price Index for August, which HM Land Registry published on Wednesday 21 October.
Three things stand out in this release:
- Slough had the 8th biggest monthly rise of England’s 295 local authority districts. In a month when 155 districts rose and 129 fell, only seven beat its 2.3%, led by Tandridge and the Forest of Dean.
- Slough is the only one of its neighbours where prices rose on the year. Windsor and Maidenhead, Reading, Bracknell Forest, Wokingham and West Berkshire all fell, and Buckinghamshire and Hillingdon were flat.
- July has been revised up by £5,924. When we reported it last month it read £335,759, down 1.8% on the year. It now reads £341,683, almost exactly where it was a year earlier.
Treat August as a first estimate
The Land Registry keeps adding completed sales to each month after it first publishes it. Slough is a small borough with only a few dozen completed sales a month, so a handful of sales can move its average a long way. The latest month with a sales count is June 2026, with 56 sales, against 88 in June 2025.
Revisions here have been large and they go both ways. In September, June’s first figure of £352,024 was cut by more than £9,000. This month, July went up by almost £6,000. August’s £349,397 will be revised too, and it would not take much to undo a 2.3% rise.
The index is also a mean average, not a median. It shows the direction of travel, not what a typical house sells for. Our Slough house prices page carries the median of completed sales instead.
What rose, and what did not
| Type | Average price | Change on the year |
|---|---|---|
| Detached | £696,100 | +1.1% |
| Semi-detached | £476,718 | +1.9% |
| Terraced | £371,039 | +1.5% |
| Flat | £226,525 | -2.3% |
| First-time buyer | £316,869 | +0.3% |
| Former owner-occupier | £437,239 | +0.7% |
| Cash buyer | £315,230 | -0.9% |
| Mortgage buyer | £353,809 | +0.6% |
Houses are rising and flats are still falling. Every house type is up on the year, with semi-detached homes leading at 1.9%. Flats are down 2.3%, which is gentler than the 4.6% fall in July’s first release but still the only falling property type in the borough.
The step from the average first-time buyer purchase to the average former owner-occupier purchase is now £120,370.
Slough against its neighbours
| Area | Average price | Change on the year |
|---|---|---|
| Windsor and Maidenhead | £583,688 | -0.2% |
| Wokingham | £491,944 | -2.5% |
| Hillingdon | £482,137 | 0.0% |
| Buckinghamshire | £477,450 | 0.0% |
| West Berkshire | £401,830 | -0.4% |
| Bracknell Forest | £391,521 | -2.3% |
| Reading | £350,501 | -0.4% |
| Slough | £349,397 | +0.4% |
| South East | £379,953 | -0.8% |
| England | £293,525 | +0.4% |
Slough is still the cheapest place to buy among its neighbours, but only just. The gap to Reading has shrunk to £1,104. Slough’s annual change matched England’s 0.4% and beat the South East, where prices fell 0.8%.
Across England, 181 districts rose on the year and 107 fell. Slough’s 0.4% puts it 162nd, in the middle of the table. Its standout is the single month, not the year.
What it means for you
- If you are selling, the index says Slough homes are worth slightly more than a year ago, and houses are doing better than flats. Do not price off one month’s jump: the last two first releases both moved by thousands of pounds.
- If you are buying a flat, prices are still lower than a year ago, though the fall has slowed.
- If you are buying a house, prices are up on the year here while most neighbours fell. Slough’s discount against them comes from a lower starting point, not a falling market.
The next release, covering September 2026, is due in November.
Sources
- HM Land Registry, UK House Price Index for August 2026, published 21 October 2026, and the UK HPI data for Slough for the average price, the type and buyer splits, sales volumes and the revised series.
- The UK HPI full file for August 2026 for the ranking of all 295 English local authority districts and the neighbouring area figures. Published by HM Land Registry under the Open Government Licence v3.0 (https://www.nationalarchives.gov.uk/doc/open-government-licence/version/3/).
- July 2026 as first published, £335,759, from the July release, as we reported it. Analysis by Slough Daily.
Have your say